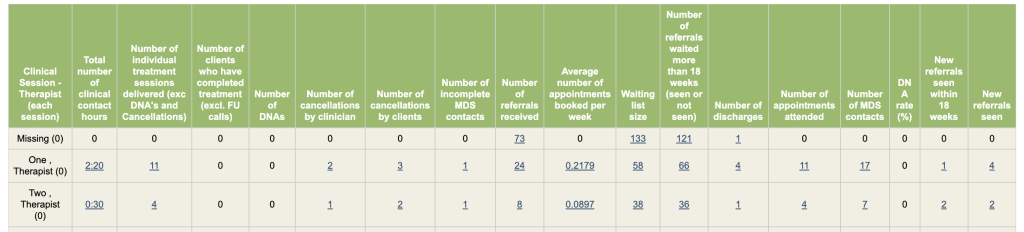
This report will return a table by the Group by option. Each column is explained below
1. Total number of clinical contact hours
Includes all sessions as long as clinical time is filled in
2. Number of individual treatment sessions delivered (exc DNA’s and Cancellations)
Includes all attendeed MDS sessions. Group sessions completed from ‘Groups’ are excluded.
3. Number of clients who have completed treatment (excl. FU calls)
Entered one of the discharge stages in the care pathway that is mapped to MDS end of care pathway option ‘Completed Treatment’. Please note that if you group the results by Therapists (each session), this figure will show No. of discharged referrals who have had sessions with each therapist. If you need to know No. of discharged referrals from the therapists they have been allocated to, use the Allocated Therapists option instead.
4. Number of DNAs
Includes all MDS sessions that are DNAed.
5. Number of cancellations by clinician
Includess all MDS sessions that are Cancelled by the service
6. Number of cancellations by clients
Includes all MDS sessions that are Cancelled by patients
7. Number of incomplete MDS contacts
All incomplete MDS sessions
8. Number of referrals received
No. of referrals received within selected date period
9. Average number of appointments booked per week
Includes all MDS sessions. You must set both start & end date for this figure to show
10. Waiting list size
This gives you total number of referrals in pathway stages of your selection. Nothing will be returned if no care pathway stages are selected from the mandatory filter. In addition, the report start & end date filters will not affect this figure.
11. Number of referrals waited more than 18 weeks (seen or not seen)
No. of referrals with more than 18 weeks of waiting between the date of referral and the first attendeed MDS session for referrals that aren’t yet discharged by the end of reporting period. If there are no attended MDS sessions completed prior to the end of reporting period, No. of weeks waiting will be calculated between the date of referral and the date at the end of the reporting period instead.
If date at the end of the reporting period isn’t specified, today will be used instead.
12. Number of discharges
Referrals entered any discharge stages in the care pathway
13. Number of appointments attended
Includes all attended MDS sessions
14. Number of MDS contacts
Includes all MDS sessions despite they are attendeed or not.
15. DNA rate (%)
No. of MDS DNA sessions divides by total No. of MDS sessions
16. New referrals seen within 18 weeks
New referrals had as least one attended MDS session within 18 weeks (including 18 weeks after subtracting patient delays) of referral
17. New referrals seen
Referrals have their first MDS session as an attended session within the reporting period. This figure should be identical to the version of KPI4 with incomplete contact included.
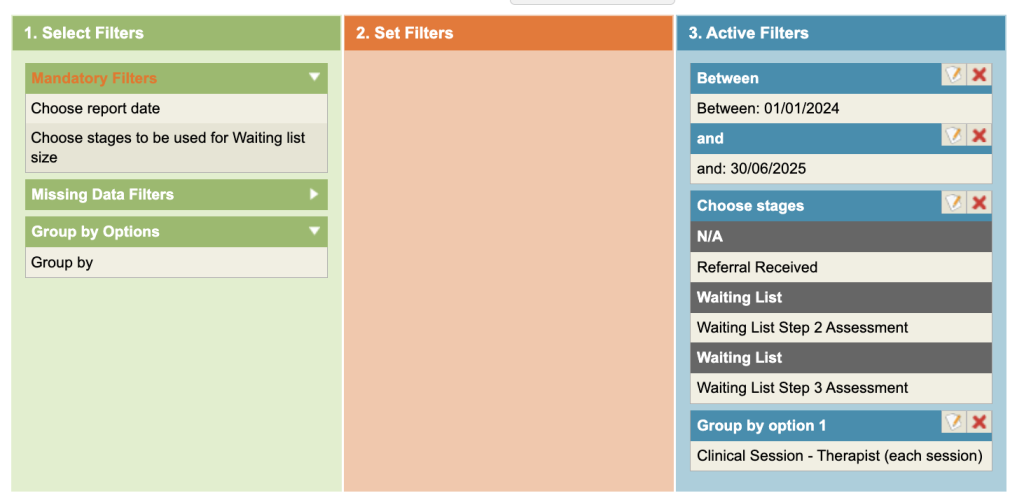
Enter the date range and select the Care Pathway stage/s that you wish to be included, as a total, in the Waiting List column.