This report will count the number of referrals which match the selected criteria. It will not include patients who have been registered but where the referral details have then not been completed.
If you run the report as is, it will provide the number of referrals since the service started including both open and completed referrals for any treatment type.
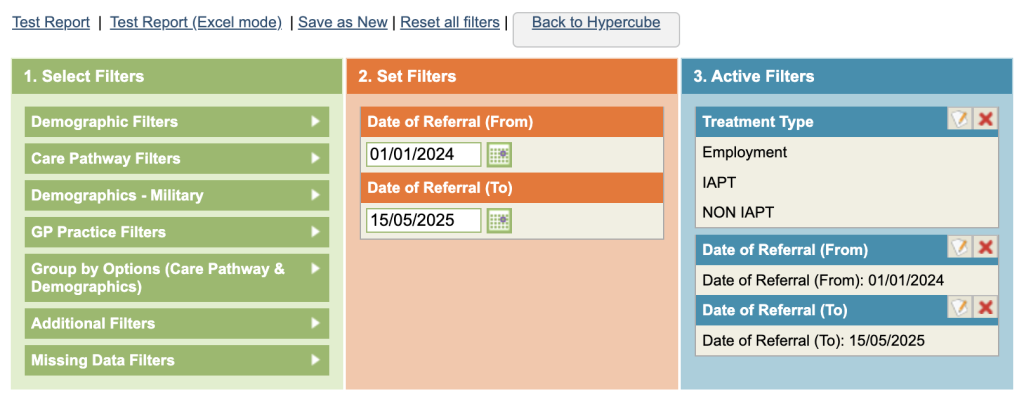
Filters are available to analyse the data and these are covered in detail below. Treatment type will automatically appear in the third column but these can then be edited by clicking on the pencil icon
In this section we will look at several common reports that can be created in here.
Referrals received in date range
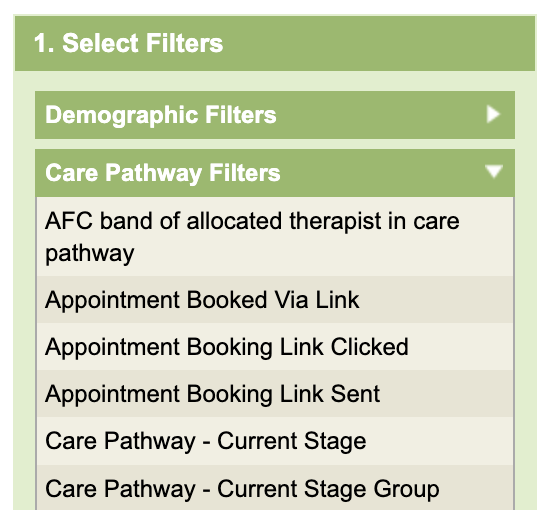
Open the Care Pathway Filters section. Search for Referral Date (Ctrl & F to activate the Find on Page or scroll to find it alphabetically)
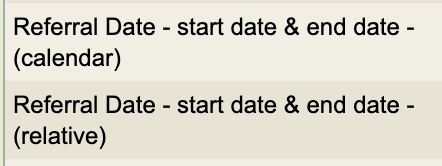
There are 2 type of date fields with reporting, calendar searches, which allows you to put hard dates in, ie start & finish and relative searches which bases the search relative to todays date.
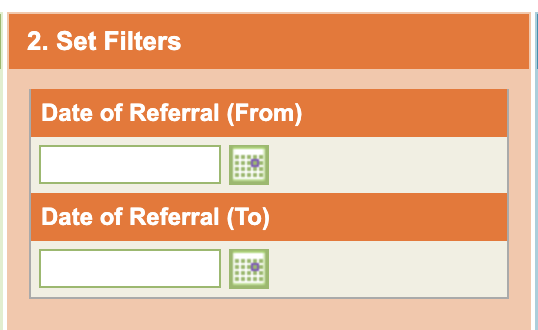
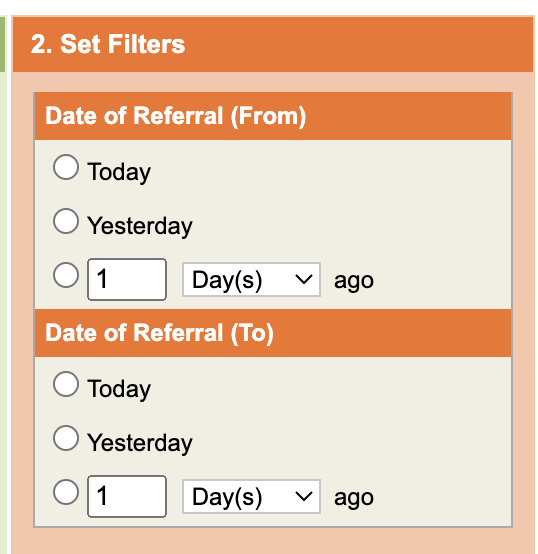
Enter the relevant dates in the second (orange) column. Wait for the dates to appear in the third (blue column) and select the treatment types you want (ie IAPT – edit and remove tick for other treatments not required).
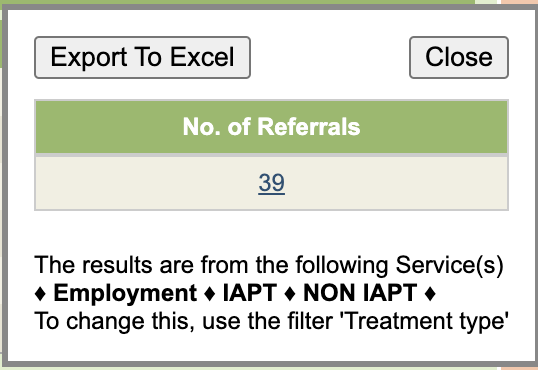
To test the report, before saving, click Test Report in the top left. The number of referrals matching the criteria will now be displayed as a hyperlink.
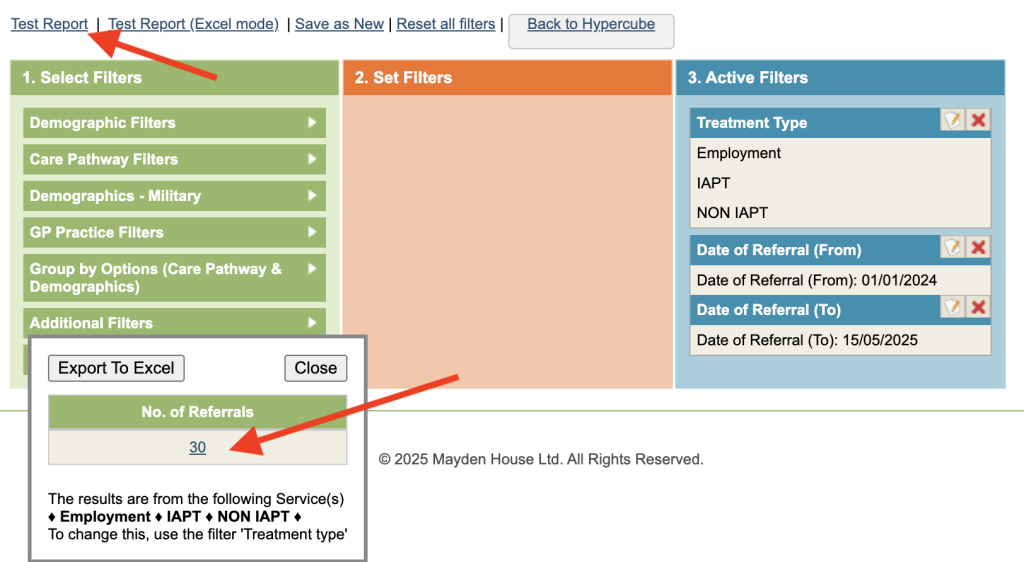
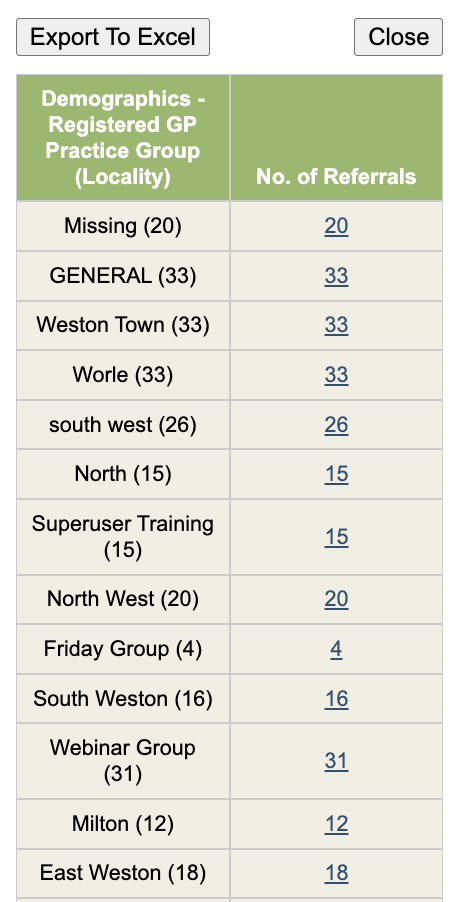
You can click on the value and a list of the referrals will
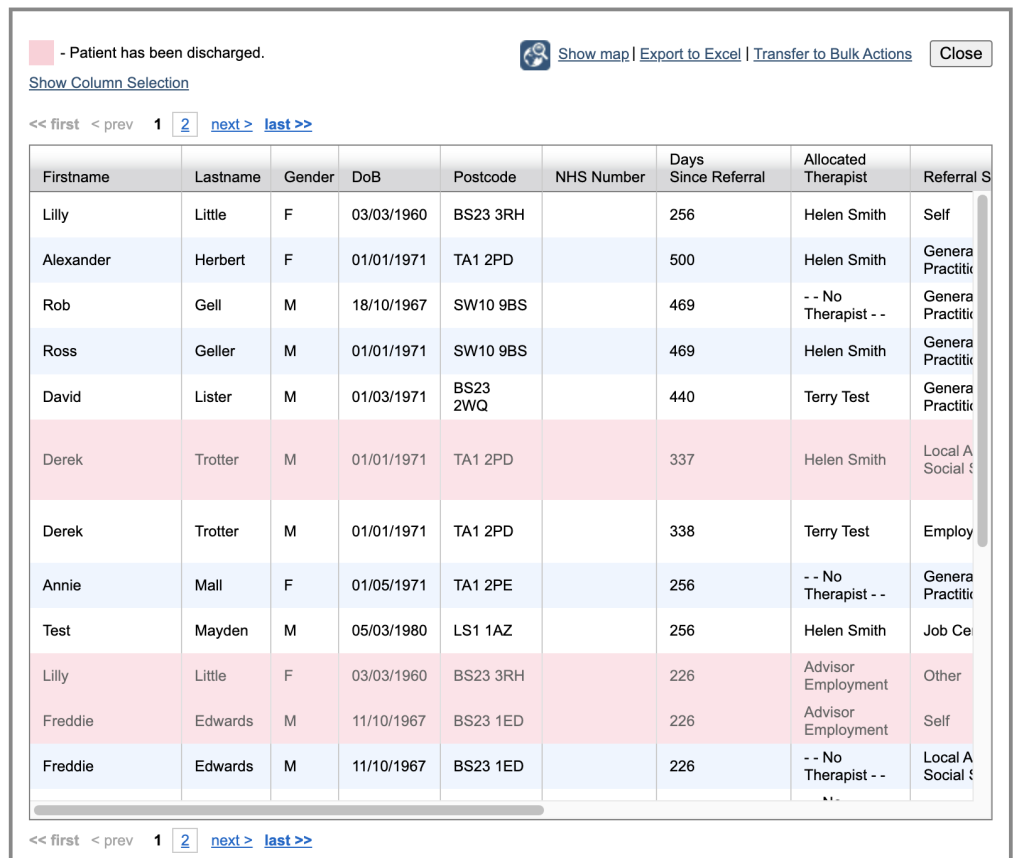
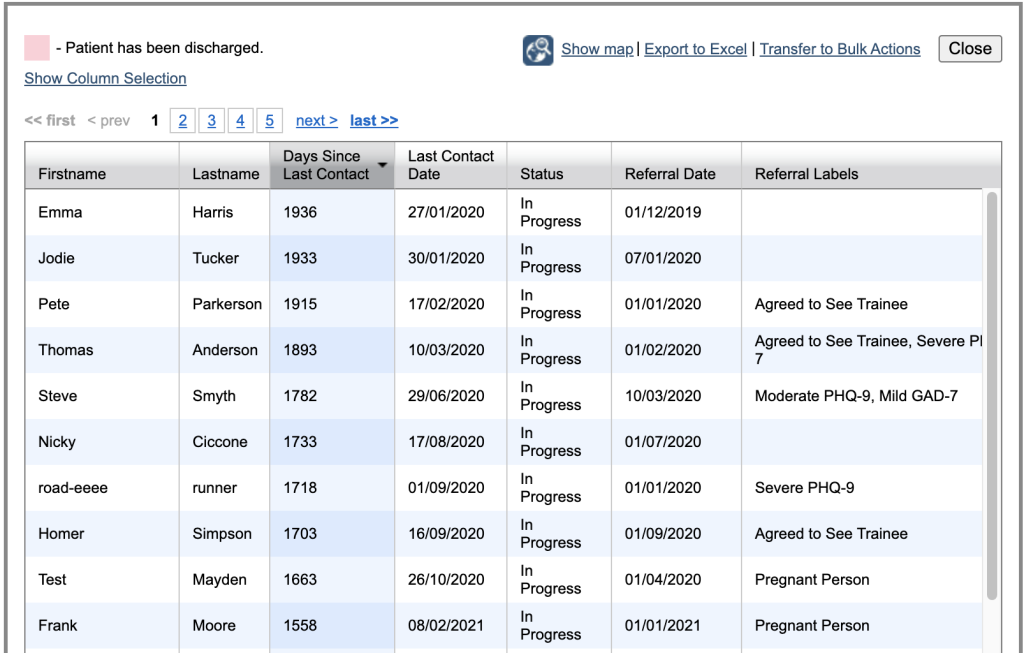
Referrals showing with a pink background are completed referrals. You can now click on the column headings to re-order the data as per the column selected.
Click on Show Column Selection to choose which fields to display.
Click on Export to Excel to export all fields to a spreadsheet.
Click on a row to open the patient record.
New Referrals in date period broken down by gender
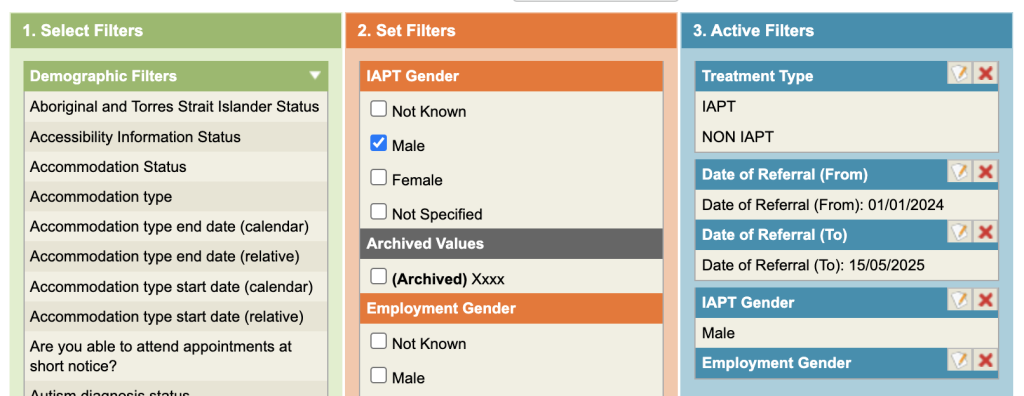
Using the above process, ensure you have chosen IAPT and entered referral dates. (If you accidentally clear the Treatment Type, it can be found under the Additional filter section.)
Select Gender from Patient Demographic Filters. In the second column select male.
Grouping
You could repeat the process to establish the number of referrals during the same period for females etc. This would mean running 2 reports to get a total for each value, however there is a much quicker way of finding this information, using a Group option.
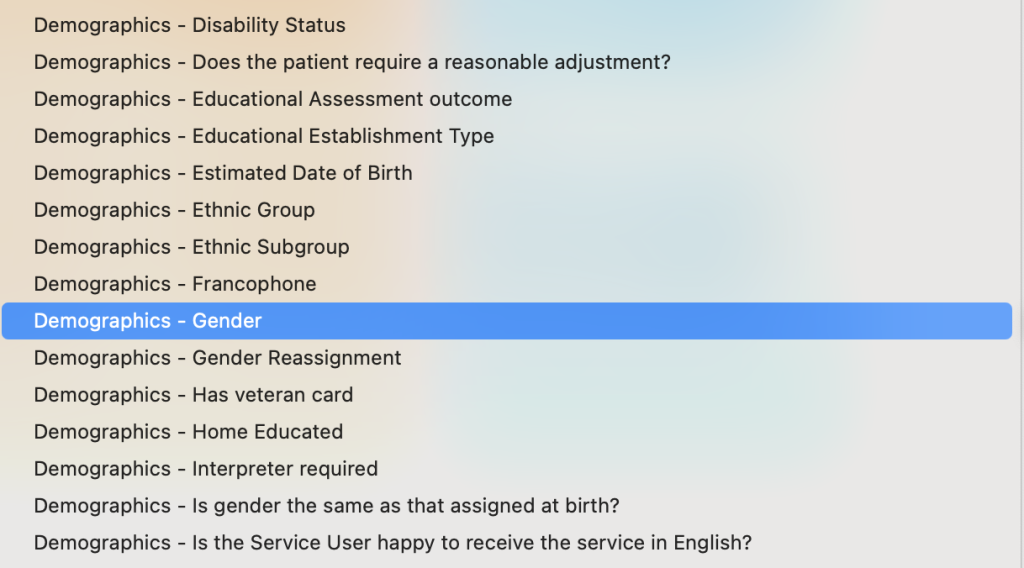
Click on the filter for Group by Options and under Option 1 scroll and select Demographics – Gender.
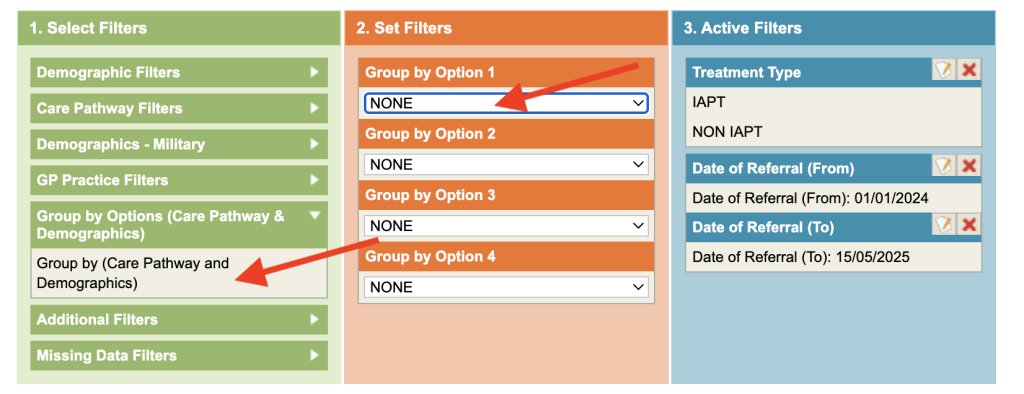
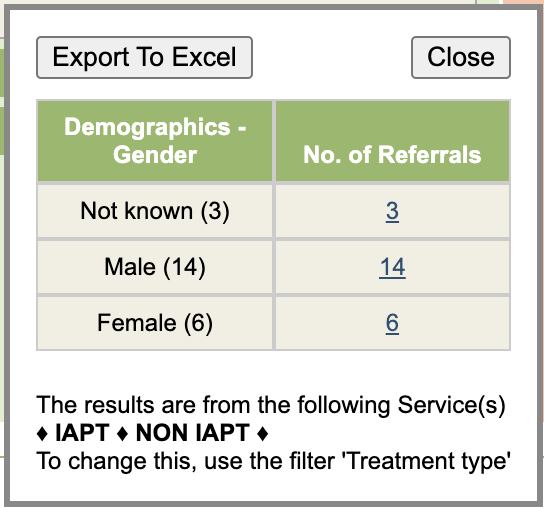
When you now run the report, the results are now broken down by gender.
You can combine the selection filters and the group options. eg select Male, Female and Not Known and
then group to have the breakdown for only these items.
Open Caseload by month
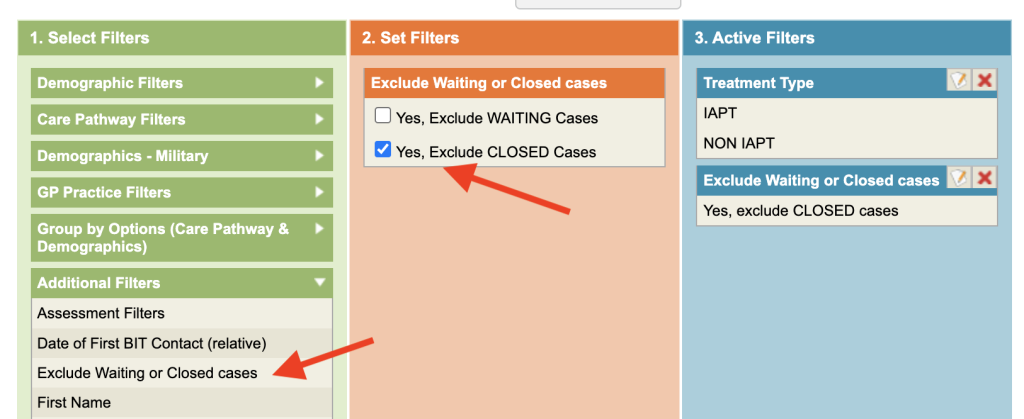
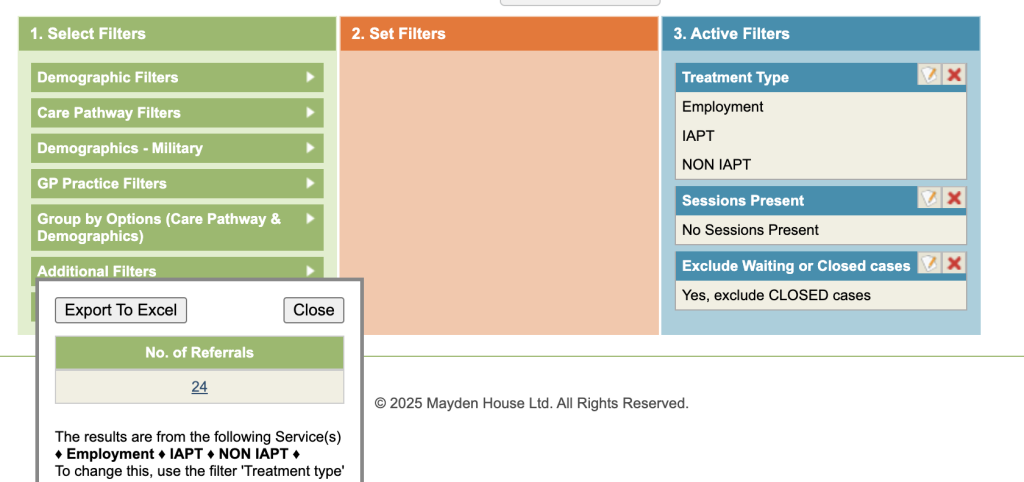
To view active referrals only. Go to the Additional Filters category and select Exclude Waiting or Closed Cases. In the Set Filters area, select Yes, Exclude Closed Cases (this will exclude discharged referrals).
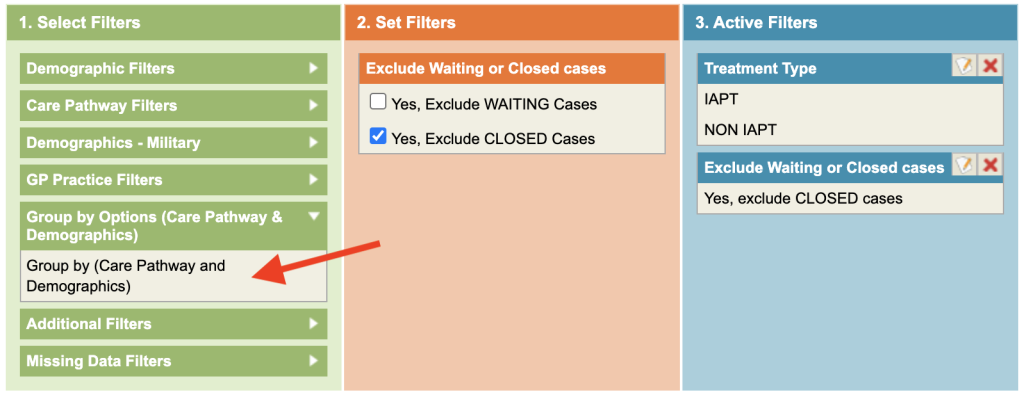
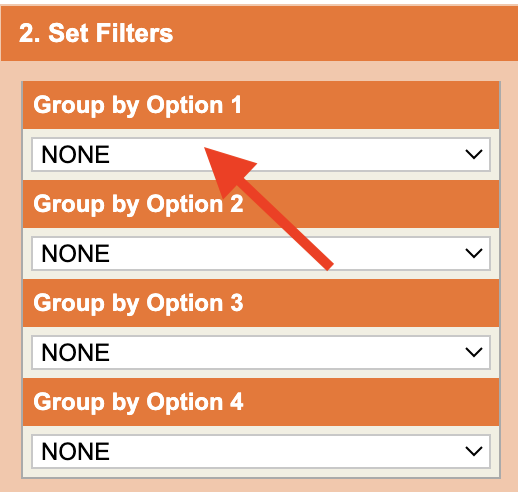
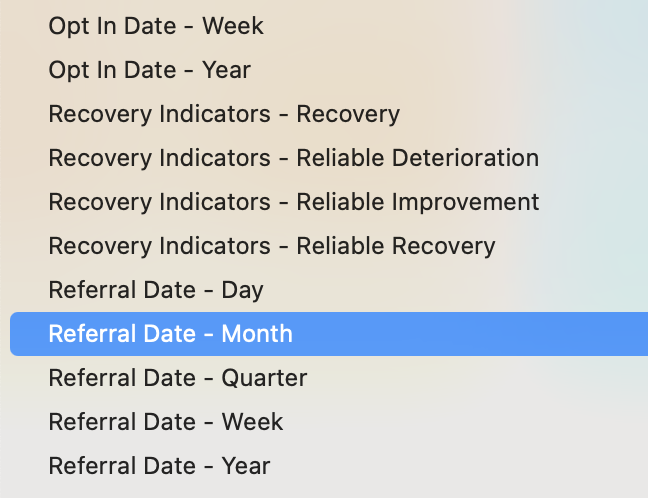
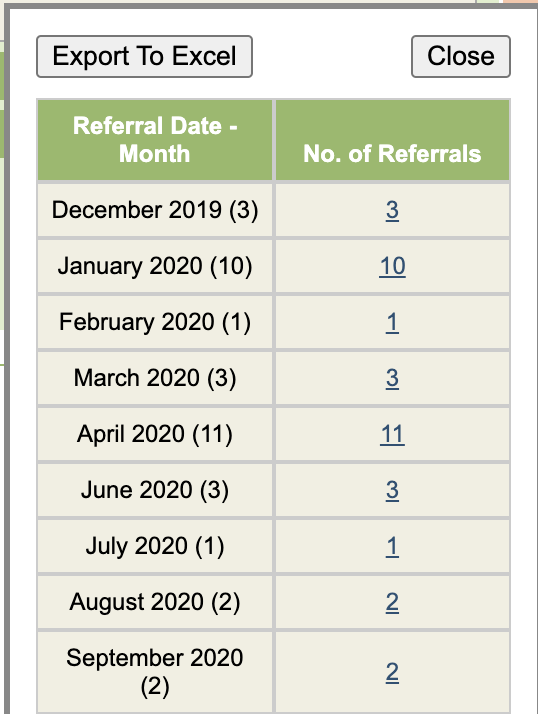
To see active referrals by month, go to the Group By option and in Option 1, scroll to the bottom, you will see the option for Referral Date – Month.
Click on Test Report.
Open Caseload by Therapist
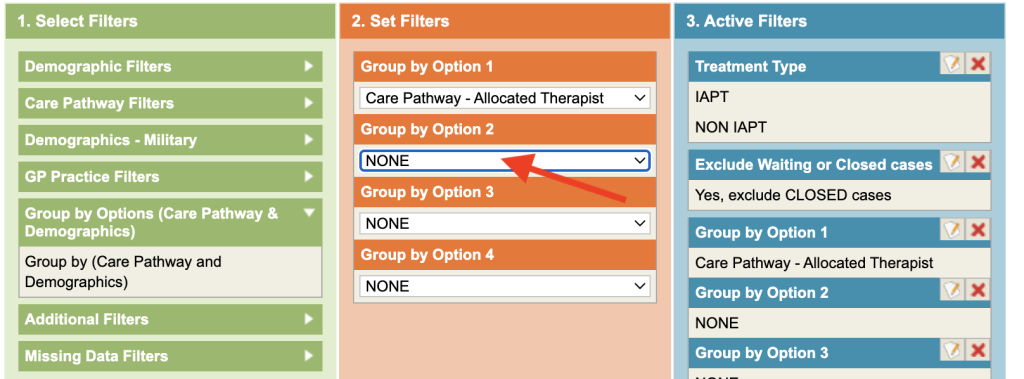
To view active referrals only. Goto the Additional Filters category and select, Exclude Waiting or Closed Cases. In the Set Filters area, select Yes, Exclude Closed Cases (this will exclude discharged referrals).
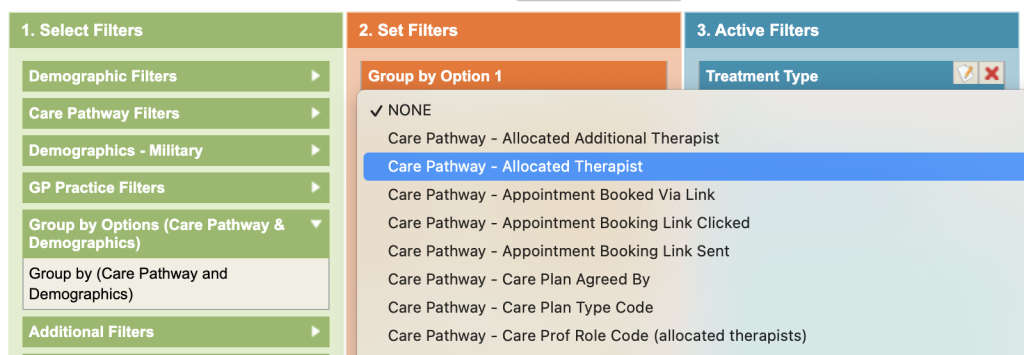
Now select the Group by option and select Care Pathway – allocated therapist.
You can add some additional options e.g. Referral Date – Month under Option 2
Add the group by Referral Date – Month in the group Option 2 and view the results.
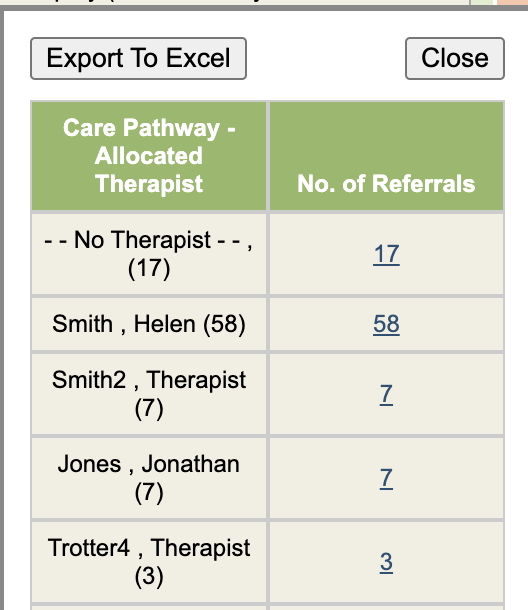
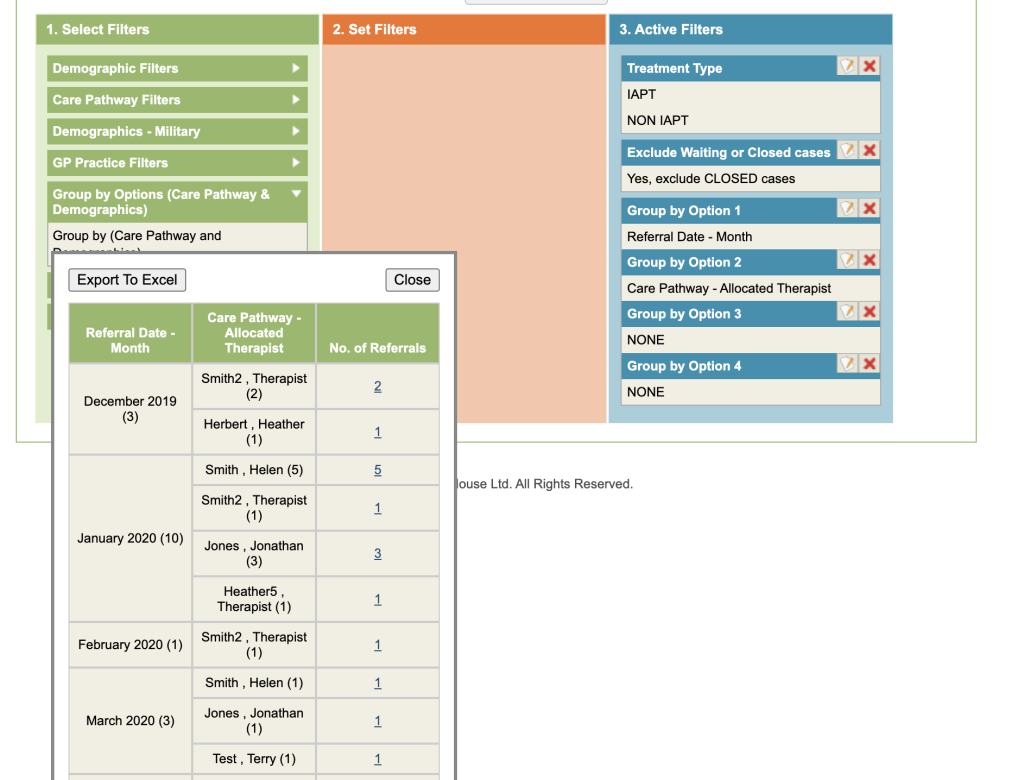
Option 1 (Therapist) appears in Column 1 and showing us the total of referral in brackets. Option 2 (Referral Date – Month) appears in column 2 and is breaking down by month for each therapist, Referral Totals for that month in brackets.
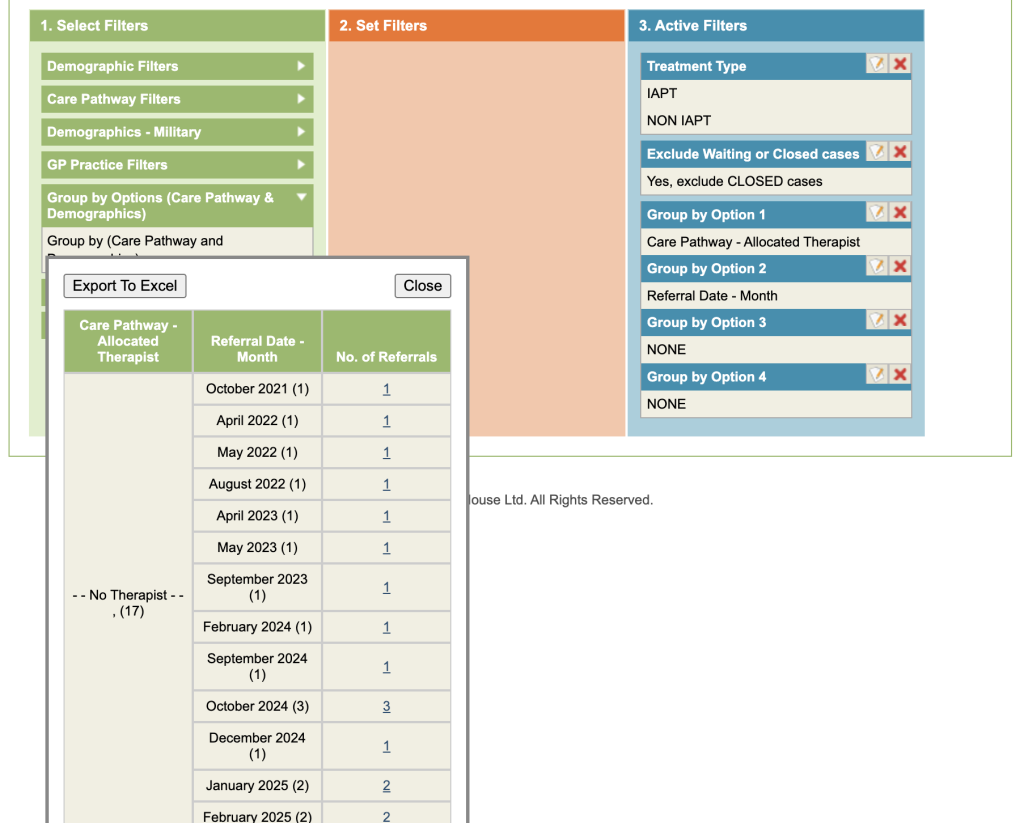
Swapping the group order can change the data. With the date in column 1 you can see the total for each month, broken down by therapist in column 2.
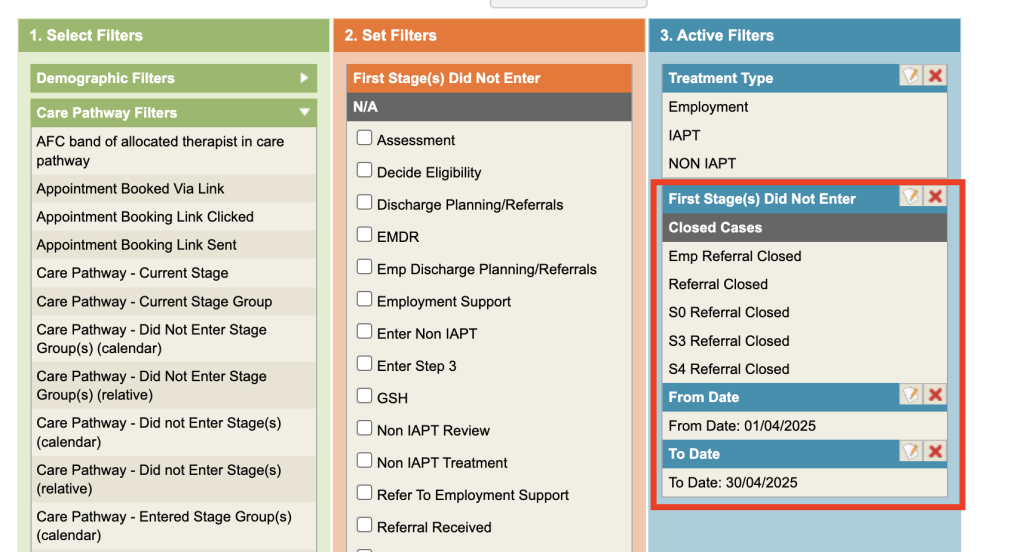
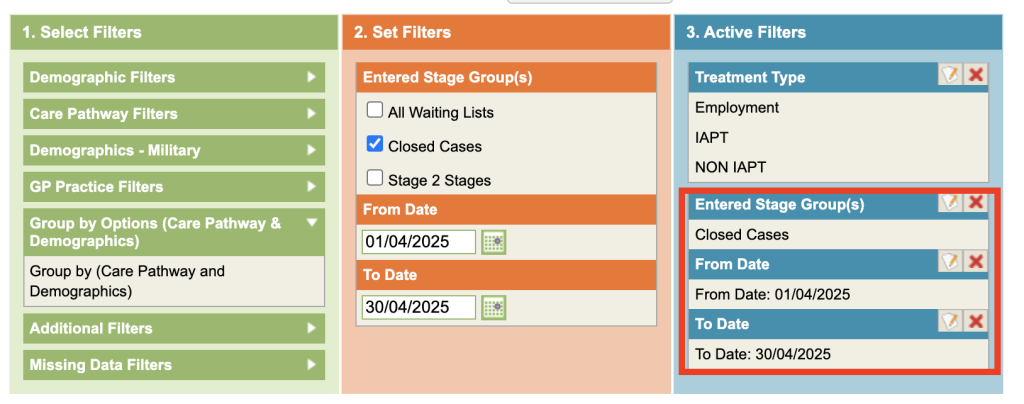
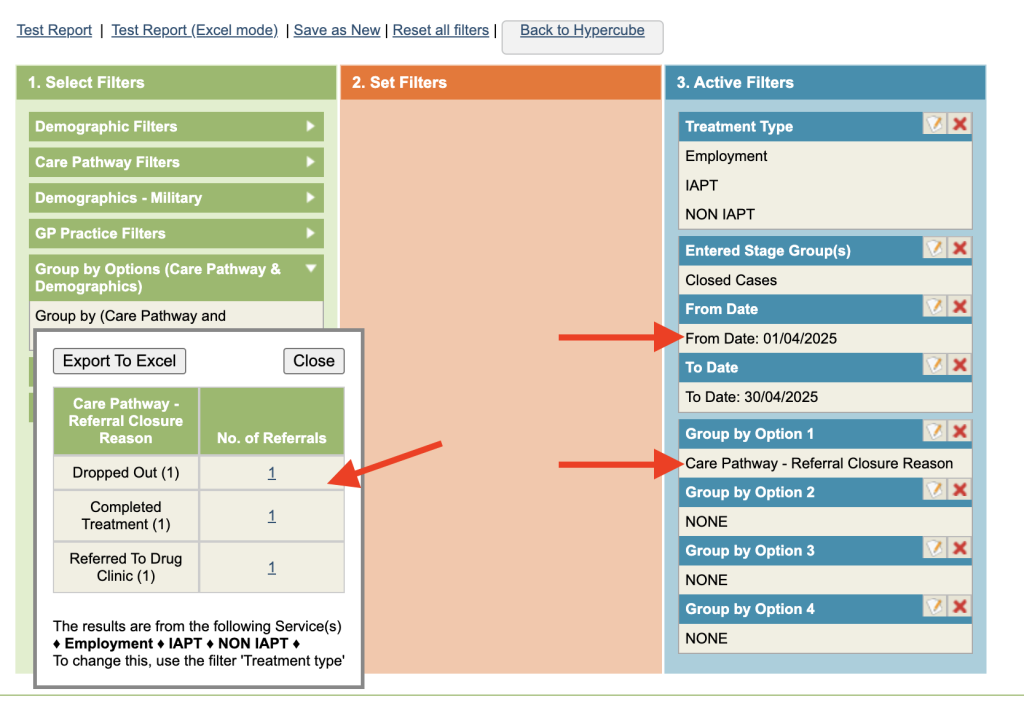
Referrals Discharged (closed cases) in Month by reason
Select all referral closed stages, either by clicking all of the Referral Closed stages under the Entered Stage (s) (calendar or relative) or by selecting the Stage Group (these can be setup by you Superuser).
Group by Referral Closure Reason
Test the report. The closure reasons are listed in the first column and a total number referrals.
Referrals by Care Pathway stage
Exclude Closed Cases (found under Additional Filters) the Group by Option 1 – Care Pathway – Allocated Therapist and Option 2 – Care Pathway – Stage (Patient currently in).
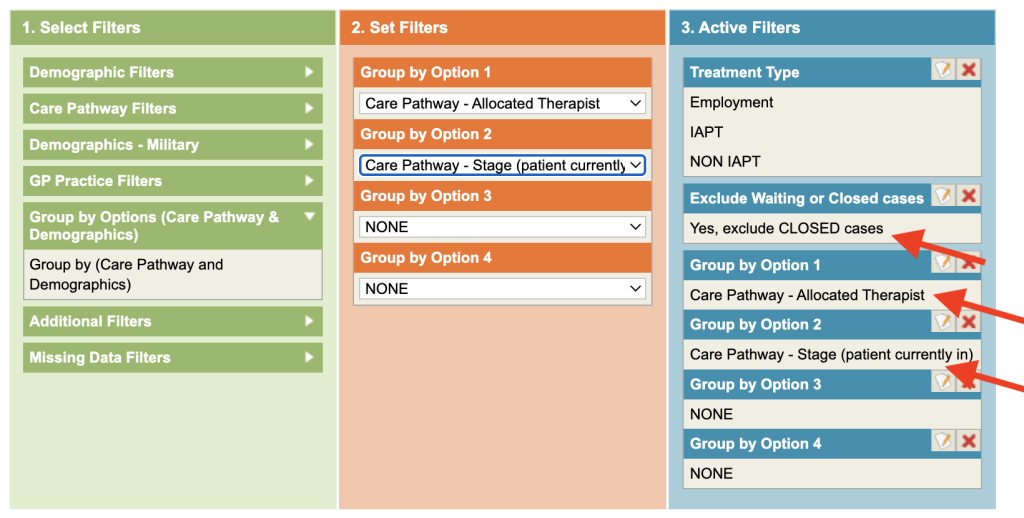
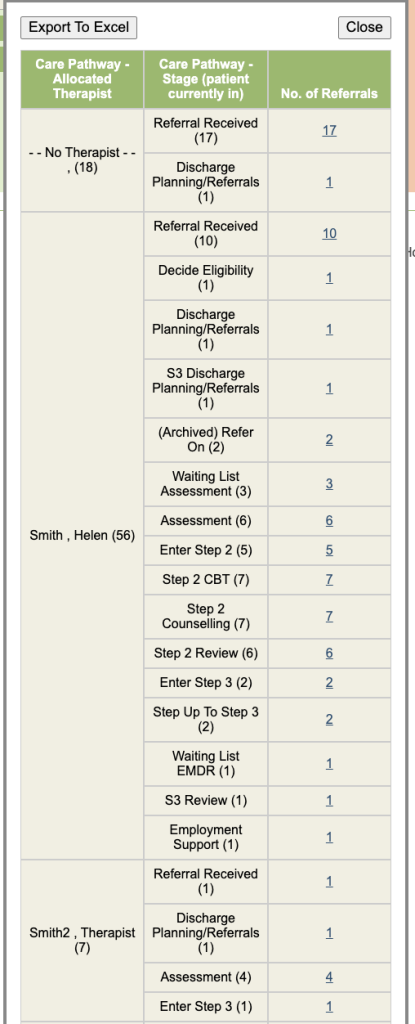
Your results should look something like this.
Missing Data Filters
The final section under Select Filters is Missing Data Filters. This section allows you to audit your data and make sure all the relevant information has been captured against a patient record.
Choose a category and set the filters in the orange column.
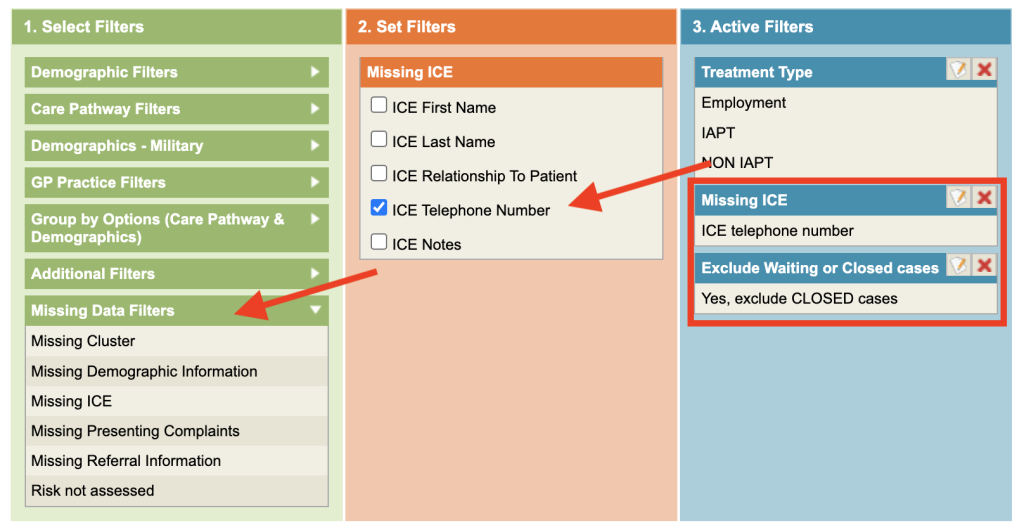
Test the report to view the results
Patients with no session booked
This report will give you patients that have no sessions booked, it will include referrals where an appointment was booked but not attended.
Filter active referrals only by selecting Additional Filters – Exclude Closed Cases. Under Care Pathway Filters, select Sessions Present – No Sessions Present
Viewing Last Contact date
When viewing the Patient table, theres are 2 columns referencing when the patient last had contact. Days Since Last Contact and Last Contact Date.
If those fields are not available please raise a support log and you account manager can switch these on.
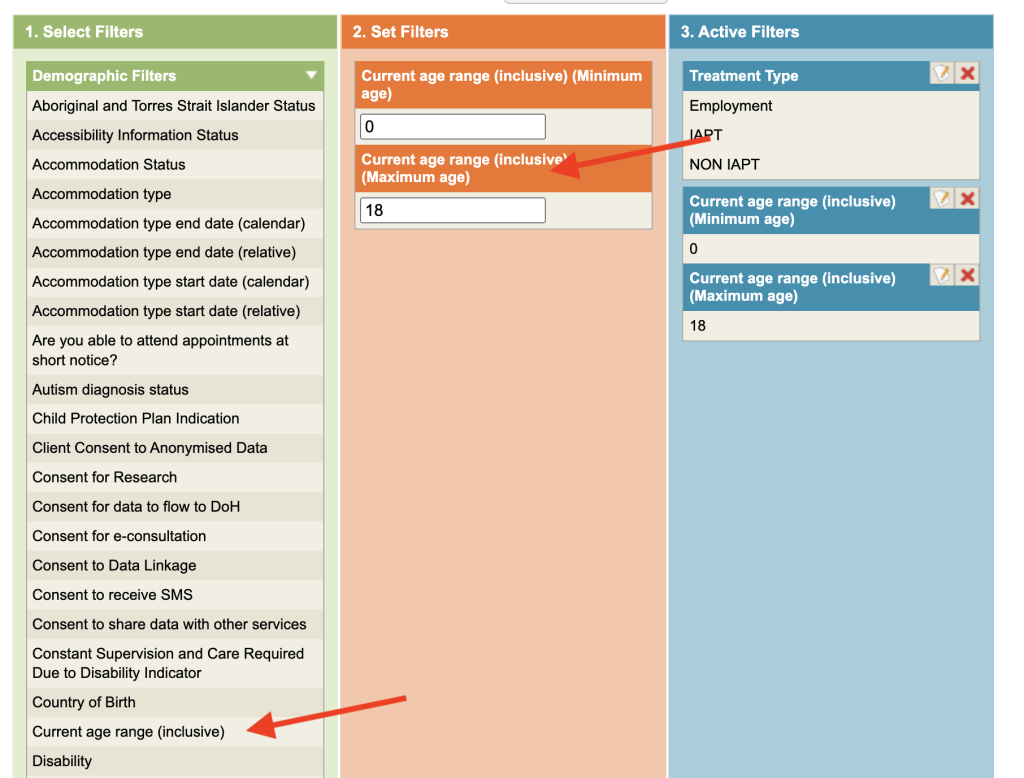
Referrals in a Age bracket
Under Demographic Filters, the Current Age Range field will allow you to query an age range.
Other interesting Groupings
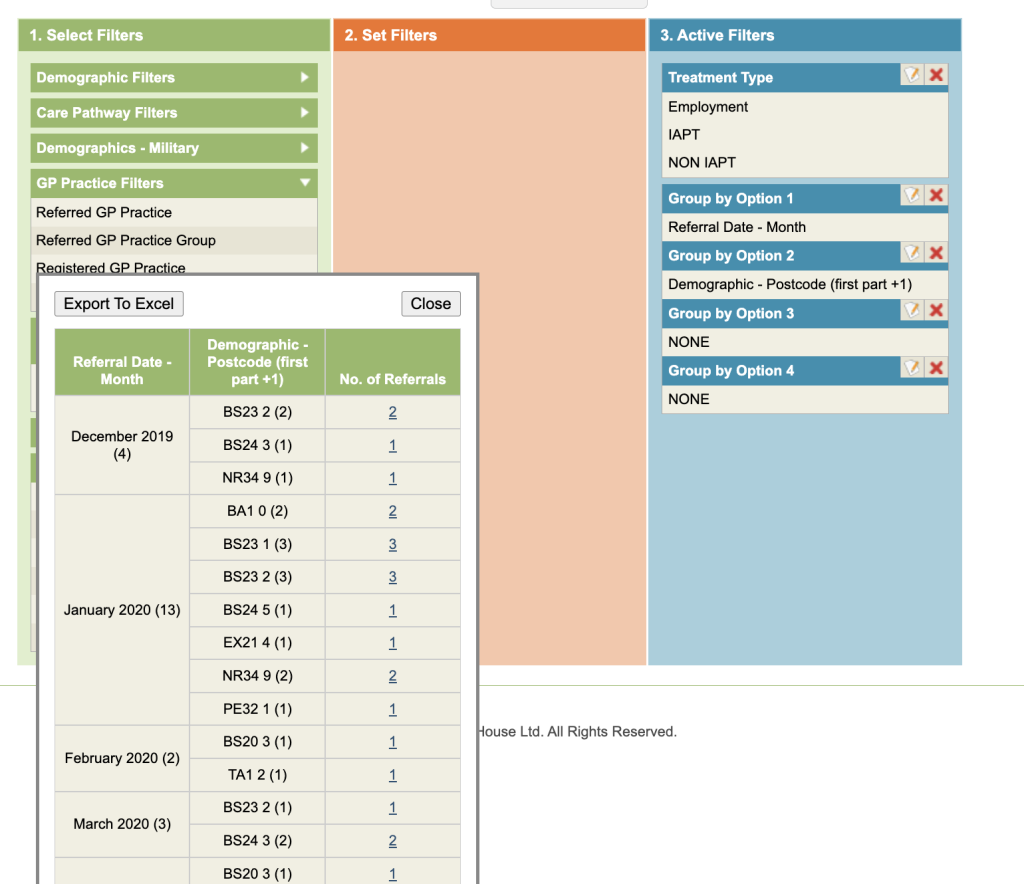
Referral Month and Postcode
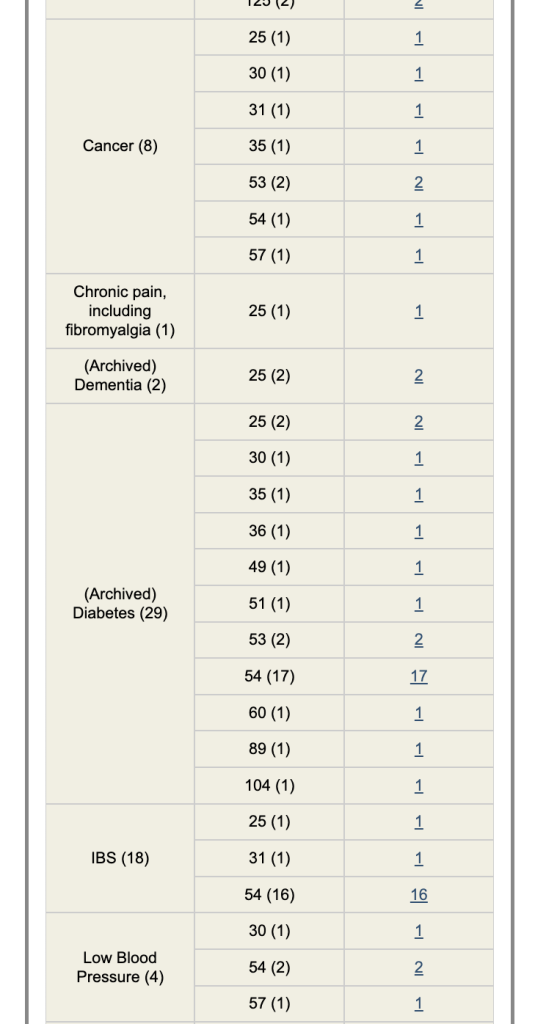
Long Term Conditions by Current Age
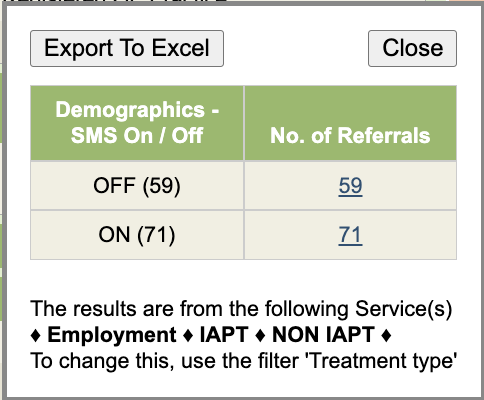
SMS Allowed On or Off
GP Groups by Integrated Care Systems (ICSs)
Please Note: GP Groups need to be setup by your Superuser