The purpose of this workbook is to provide information on questionnaires submitted to iaptus. It is limited to questionnaires, or questions within questionnaires, which have a SNOMED code attached to them, ie, it is only those which could be submitted as part of either the IAPT or MHS datasets in the 606 or 607 tables.
IAPT recovery
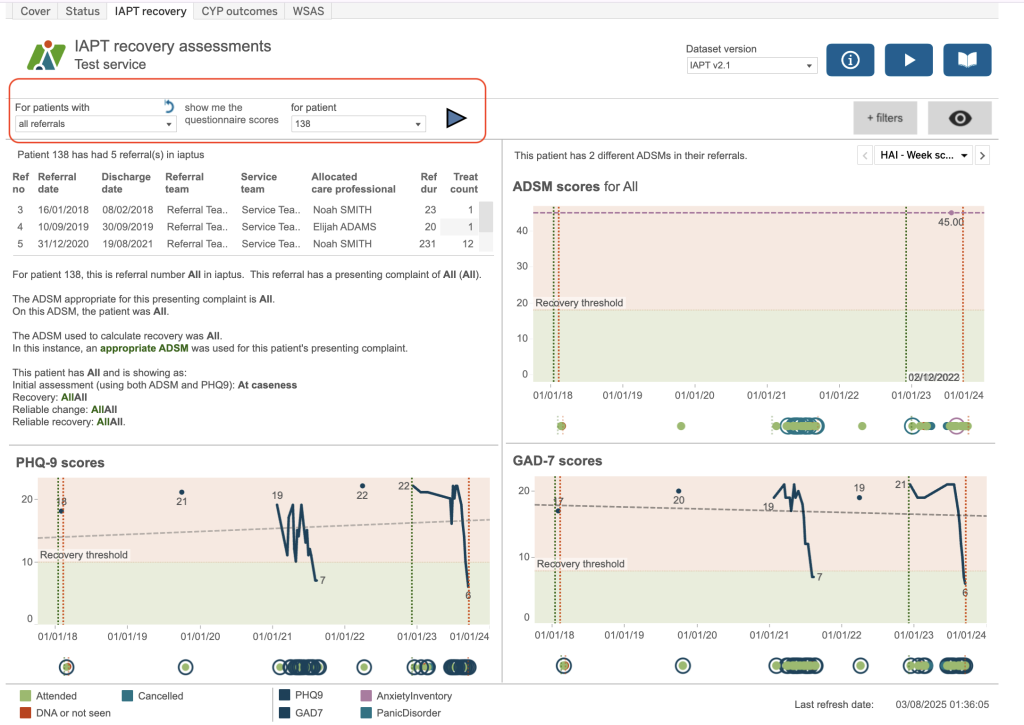
When you first open the IAPT recovery dashboard, there may not be any patient selected. This would be indicated by brackets around the patient ID in the dropdown. To select a patient, either choose to look at all referrals or referrals received, ended or open within a particular period. The list of patient IDs will update depending upon your selection. Click on the patient ID you’d like to view and press play. This loads the information for your selected patient. You can use the filter options available in order to restrict the list of patients selected. To remove all the filters, press the reset filters icon.
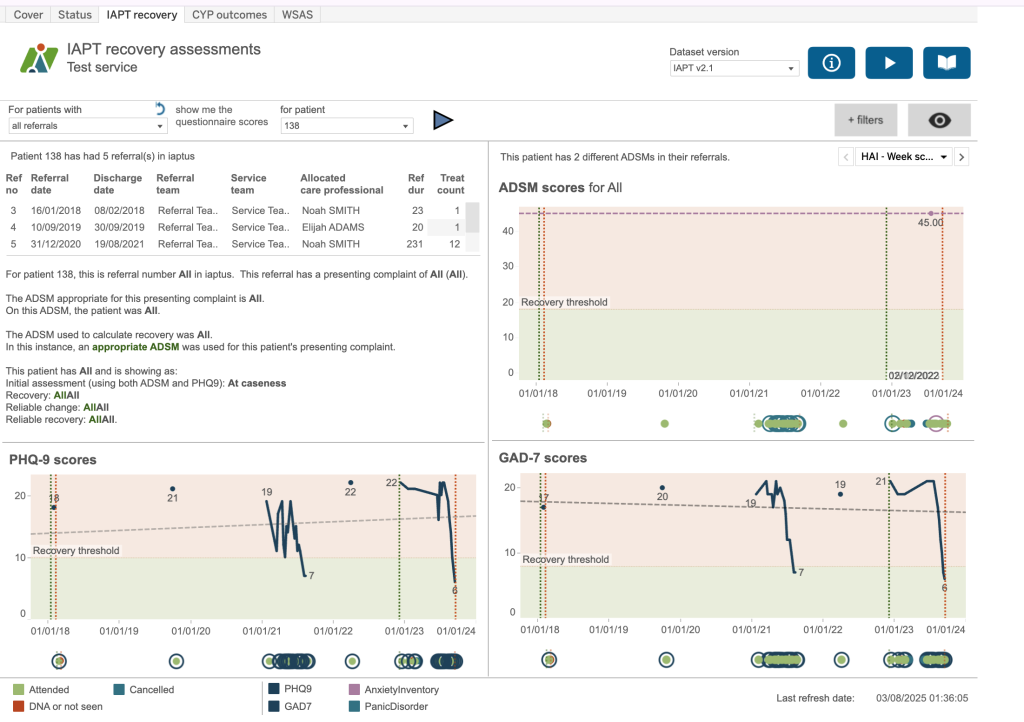
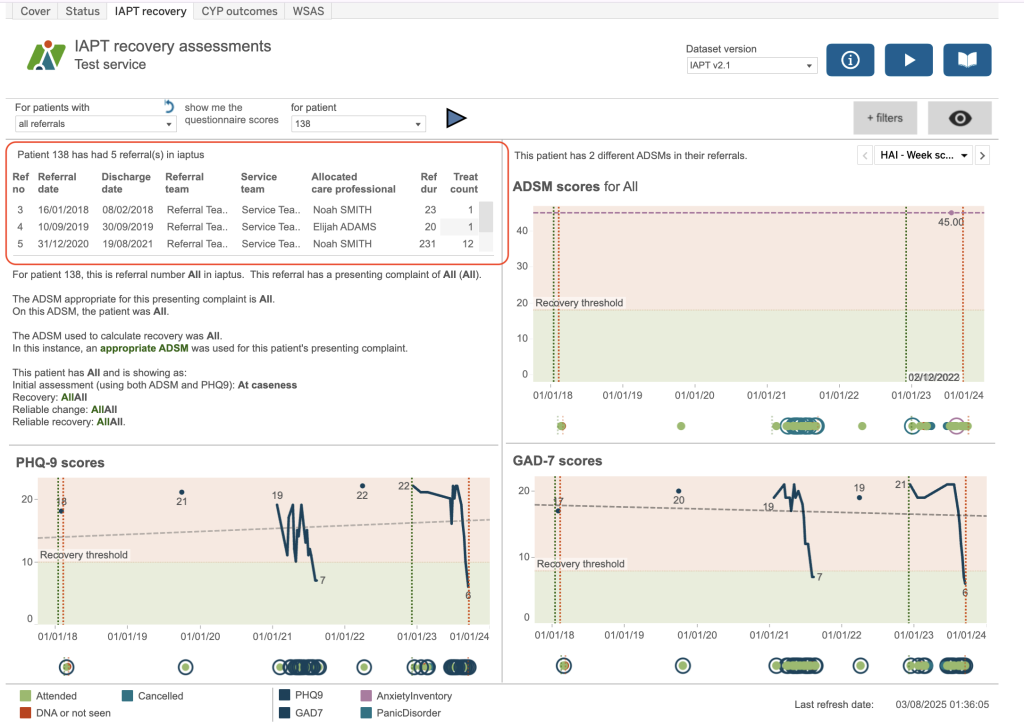
The top left box shows all the referrals for that patient – the referral number, the referral date and discharge date along with the allocated care professional, the referral duration in days and the number of treatment appointments. Please remember not all referrals for a patient may be loaded into this area. For this patient the first referral we have is number 3. We have applied a date restriction on the overnight extracts so that we are not displaying too much historical data which will slow dashboards. The cut-off date for your service is shown on the information button. If you need to adjust this date, please contact your account manager via a support log.
The charts show initially with all the scores for that patient loaded. There is a chart for PHQ9, for GAD and, if applicable, for any ADSMs collected. Here we have two ADSMs: HAI and PDSS. You can use the drop down or the arrow to move between the different ADSM scores. Underneath each of the charts is a series of dots which represent any contacts with the colour showing the attendance. The rings represent the scores collected so you can see when scores are collected as part of a contact or, if the ring isn’t around a dot, when a score is collected outside a contact. The green and red dotted vertical lines represent the referral start and end date.
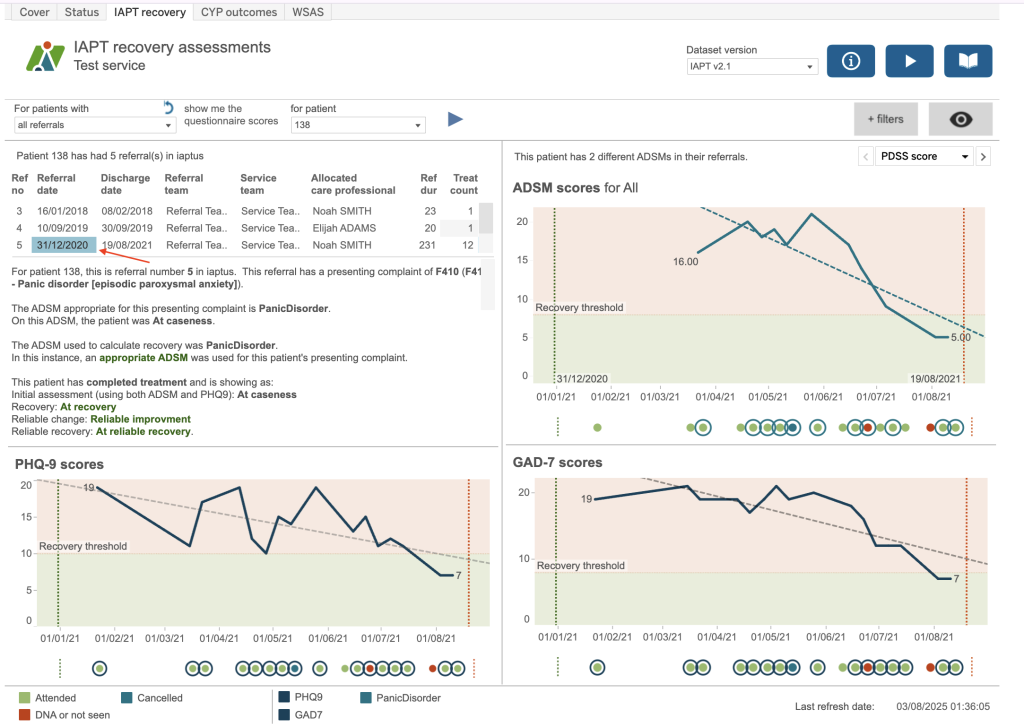
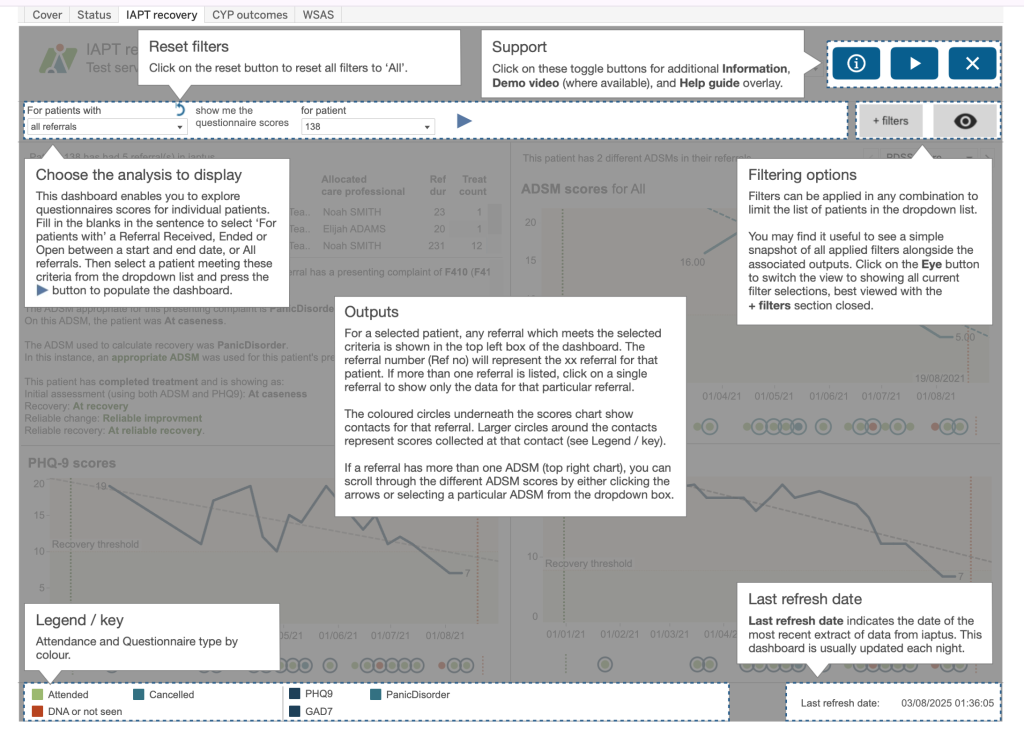
In order to see recovery text for a referral, please select a referral from the list. You may see a message: ‘No recovery calculations were carried out on this referral. Please select an alternative referral or patient from above’ in which case no calculations could be carried out for that referral and you need to adjust the selection. When you click on the referral row, the data displayed will be limited to that associated with the selected referral. At the top right of each main dashboard you will see some blue buttons which are designed to help you. Here we have an information button, a demo video button and a help guide button to bring up an overlay of useful hints. The information button will identify any filters which have been applied behind the scenes that you don’t have access to or any special calculations. You will be able to access this video from the demo video button. And finally, should you wish to refer back to any of these tips, you can find a summary of this information in the Help guide built into each dashboard showing an overlay of helpful prompts.
CYP Outcomes
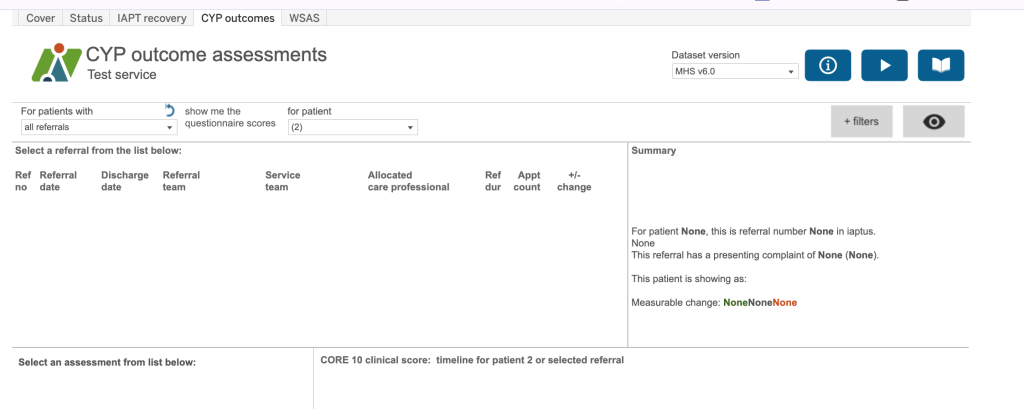
When you first open the CYP outcomes dashboard, there may not be any patient selected. This would be indicated by brackets around the patient ID in the dropdown. To select a patient, either choose to look at all referrals or referrals received, ended or open within a particular period. The list of patient IDs will update depending upon your selection. Then click on the patient ID you’d like to view and press the play button. This loads the information for your selected patient. You can use the filter options available in order to restrict the list of patients selected. To remove all the filters, press the ‘reset filters’ icon.
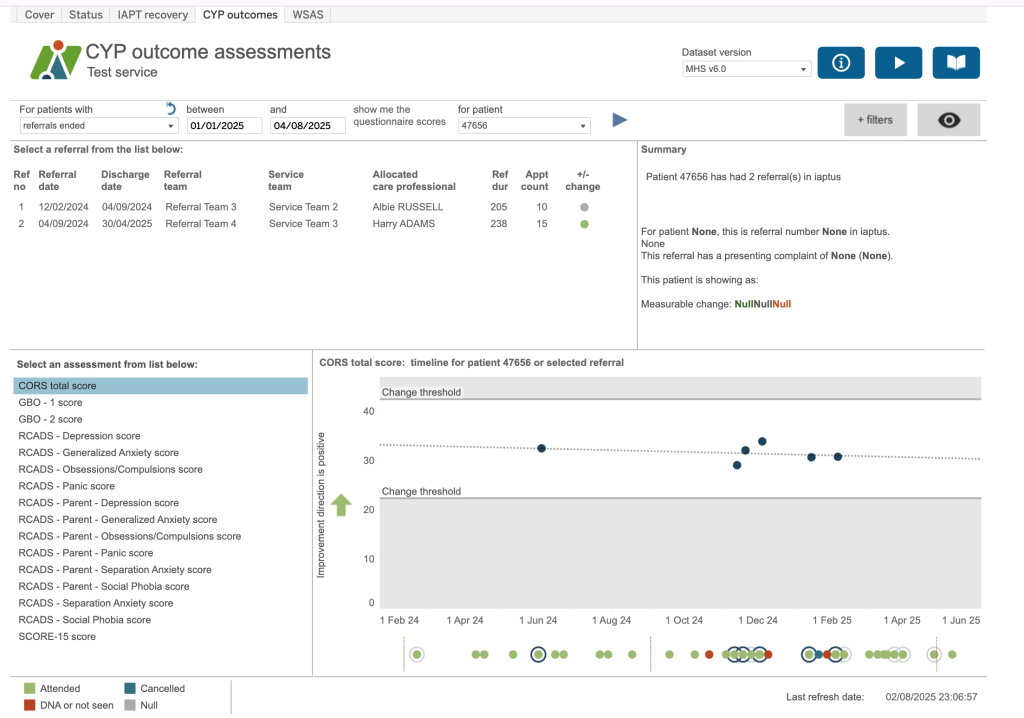
Once your patient has been selected and loaded, the top left box shows all the referrals for that patient – the referral number, the referral date and discharge date along with the referral team, service team, allocated care professional, referral duration in days, number of appointments and a reliable change indicator, in other words, whether the referral is showing as reliable improvement, no reliable change, reliable deterioration or, not applicable for those where we do not have enough data to do the calculation. Please remember that not all referrals for a patient may be loaded into this area. This is because we have applied a date restriction on the overnight extracts so that we are not displaying too much historical data which will slow dashboards. The cut-off date for your service is shown on the information button. If you need to adjust this date, please contact your account manager via a support log.
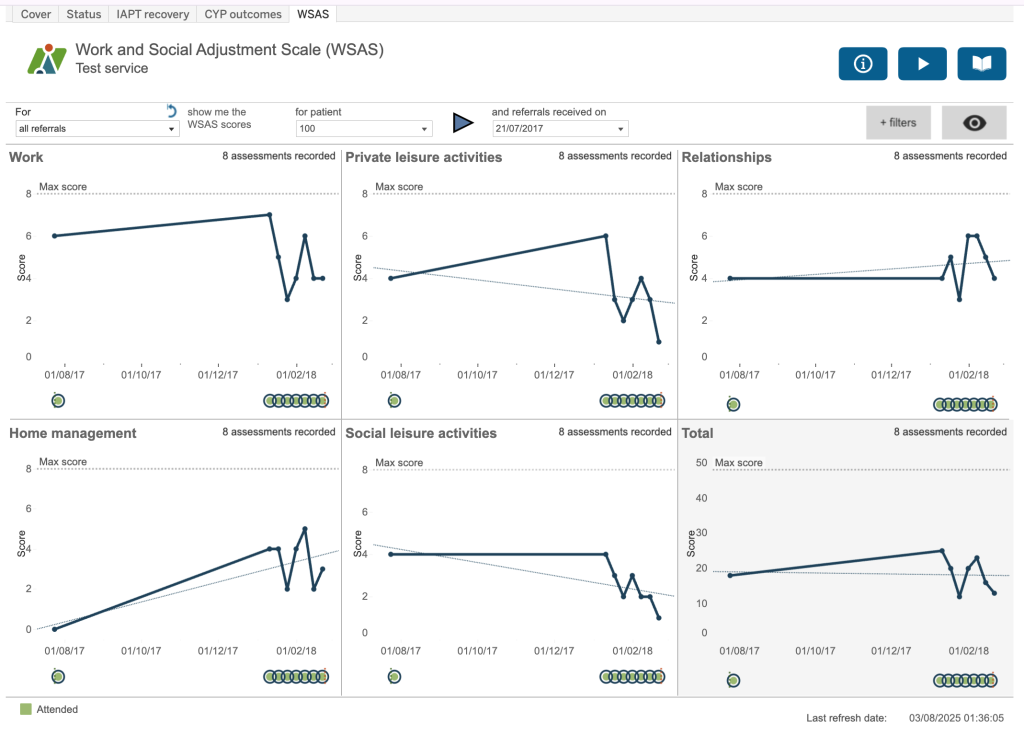
WSAS – Work and Social Adjustment Scale
The WSAS dashboard shows all the Work and Social Adjustment Scales scores. If you have moved to this dashboard via the IAPT recovery or CYP outcomes dashboard, the patient previously selected will be displayed. You have the same filters available to select a patient but rather than having a box showing each of the referrals, you have a drop down box which shows the referral start dates for each referral associated with that patient.
There are five charts for WSAS: work, private leisure activities, relationships, home management, social leisure activities and also one for the total. Like the previous dashboard you have a chart showing the score and then one showing the contacts with attendance and a ring identifying when scores are collected. The Work chart can have a value of 9 (which is above the maximum) which means not available. This value is not included in the total score and, as it is displayed on the chart, we do not show a trend line which would be skewed by these values.